| Tom Ewing |
| Tue 13 Nov 2018, 10:00 - 13:00 |
| Lister Learning and Teaching Centre, Room 4.3 |
If you have a question about this talk, please contact: Lukas Engelmann (lengelma)

Please RSVP via Eventbrite
Ad-hoc Seminar by Tom Ewing, Professor of History, Virginia Tech
“The Numbers Attacked Have Assumed Alarming Proportions”
Narrative Reporting and Data Visualization during the Russian Influenza, 1889-1890
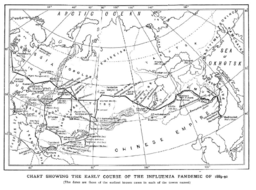
In a December 8, 1889 article in the British Medical Journal , Dr. Frank G. Clemow provided one of the earliest expert reports on a new epidemic that would become known as the “Russian influenza.” Writing from St. Petersburg, he described the first reports of the disease, the common symptoms, the usual course for patients, and the impact on Russian society. To illustrate his claim that “the numbers attacked have assumed alarming proportions,” Dr. Clemow referred to schools and factories closed because of absences, hospitals full to overflowing even as medical professionals themselves fell ill, and even the Emperor and many family members suffering from a disease that affected “high and low, old and young.” In months and years to come, Clemow would continue to report on the influenza, including articles in Lance t and Public Health and a chapter on influenza in his influential treatise, The Geography of Disease (1903), which included a map identifying the first cases across the Russian empire. This paper uses Dr. Clemow’s reports to explore narrative reporting and data visualization as tools for understanding the Russian influenza as both a specific historical event and as an example of epidemic disease on a global scale. First-hand narrative reporting appeared in medical journals and popular newspapers, and often explored the themes identified initially by Clemow, including the symptoms, course of illness, possible treatments, likely outcomes, and impact on society. The scope and severity of the disease often involved personal observations, but also statistical reports on the number of cases and deaths, as well as maps, charts, and diagrams intended to illustrate and analyze these processes. By exploring how observers such as physicians, journalists, and health officials used narratives and data to make sense of the disease, this paper contributes to a broader discussion of how the digital humanities provide new perspectives for understanding the impact of global diseases.
(Map from Frank G. Clemow, The Geography of Disease, (Cambridge: At the University press, 1903), following p. 192.)


